As we look to the 2020 Census, segregation remains persistent in Miami. A history of active delineation, deed restrictions and redlining has led to this phenomenon.


The history of segregation in Miami goes back to the founding of the city in 1896. At this time, the charter was required to designate a colored section of each city in Florida, which was designated to be West of the Flagler railroad tracks, and north of the Miami River. This area was named Colored Town and housed many of the workers of the railroad that brought people to the city, and of the hotels that began our bustling hospitality industry.


Colored town has a rich history, hosting luminaries such as Aretha Franklin, Sam Cooke, Muhammad Ali, and Ella Fitzgerald. In the 1920s, NW 2nd Ave, the street that ran through the heart of colored town, was dubbed “little broadway” because of the many high profile performances it hosted.
Coconut Grove is another neighborhood with a steeped black history going back before the founding of the city. Many black settlers from the Bahamas came to this part of Miami in the 1880s. They helped construct hotels and were a part of the founding charter vote in Miami.

Liberty Square Upon Construction
Due to restrictive covenants, Colored Town and Coconut Grove remained the only places black people could live until the late 1930s. Upon the election of FDR and the enaction of the New Deal, a commission inspired by black leaders in Colored Town, but entirely made up of white men lobbied FDR to include a housing project on the then outskirts of Miami into the New Deal. Liberty Square was constructed in 1937 with over 200 units. As it was built directly west of the mostly white suburbs of Buena Vista and Lemon City, a wall was constructed along NW 12th Ave blocking the development from view. The project housed mostly middle-class black families, and small suburbs began to sprout up around it. The Miami planning board at the time was actively trying to relocate blacks to the outskirts of the city, in order to expand the Central Business district.
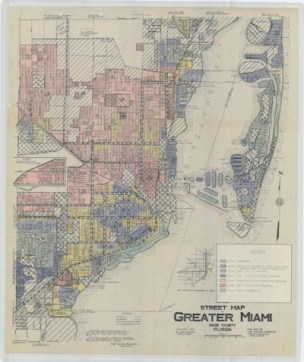
Banks deemed certain areas to be risky, and did not value the property as highly as other areas. A factor in this riskiness was race.
In addition, banks began disenfranchising middle and upper-class black families through a property rating system that came to be known as redlining. These “security maps” were created by the Home Owners Loan Corporation and would grade areas of the city from an A to a D rating. The rating criteria included area amenities, zoning, housing stock, and racial makeup. These practices did not allow people living in these areas to get loans based on their merit, and disenfranchised them from the 1930s until the civil rights acts. If you note the map above, red is the lowest rated area, and further coincides with the history of segregation in the city of Miami.

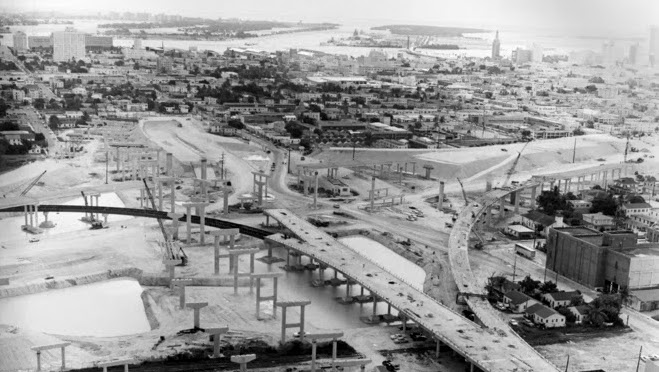
Construction of I-95 through Colored Town
With the civil rights acts of 1964 and 1968, also came the construction of the I-95 effectively slicing through Colored Town, and displacing over 40,000 people. At the same time, thousands of Cubans began entering Miami due to the Cuban revolution, settling in Little Havana and Hialeah by designation of the Cities of Miami and Hialeah. Many blacks went North to underdeveloped areas of Miami, including around and in the Liberty Square project. This pushed a lot of families living in Liberty Square further north to places like Miami Gardens and Opa Locka.

Data from 2010 Census
Looking at the map today, this history of segregation is clear. Whites and Hispanics primarily live south of the Miami River, East of the Flagler Railroad, and in Hialeah. Non-whites live West of the Flagler Railroad, North of the Miami River, and East of Hialeah. Segregation is not always a choice or a result of self-selection. In the case of Miami, and many American cities, it was an intentional separation of non-whites from whites in an effort to provide separate services, schooling, facilities, and housing. It is a part of history that can be tracked and seen through law, private deed restrictions, and bank policies of redlining.
Today, schools continue to be segregated, and in Florida, the percentage of 95%+ population non-white schools is increasing. As we approach the census and the redistricting of Miami, this history will play a vital role in perhaps correcting the issues and wrongdoings of past administrations. Let us acknowledge and seek to reverse this history as intentionally as it was created.
Follow us on Instagram, Facebook, and Twitter!
—
Sources:
https://www.miaminewtimes.com/news/miami-school-segregation-is-arguably-the-worst-in-florida-9704823
https://miamiplanning.weebly.com/racial-segregation.html
Click to access LCI-Tough-Choices-Patterns-of-Resegregation_FINAL.pdf
https://www.wlrn.org/post/map-south-florida-shows-how-racially-segregated-we-are
http://cdn.miami.edu/wda/cce/Documents/Miami-Housing-Solutions-Lab/raceAndProperty.html

Thank you for the informative post! Hopefully Florida can get its act together.
LikeLike
Quite a thorough analysis. After reading this article a lot of things cleared up in my head. For example, why is it so difficult to find a school in my old district..
LikeLike
Thanks for your feedback! Glad you enjoyed it. I try to tell whole stories about our city that we may only experience in bits and pieces.
LikeLike
The City of Miami Should be Sued including the Police department.. for years of mental abuse psychological abuse on the citizens of Coconut Grove the Black Community.. cops didn’t want them out or driving away from its neighborhood.. I clearly remember
LikeLike
[…] 2 https://miami-grid.com/2019/04/10/segregated-miami/ […]
LikeLike